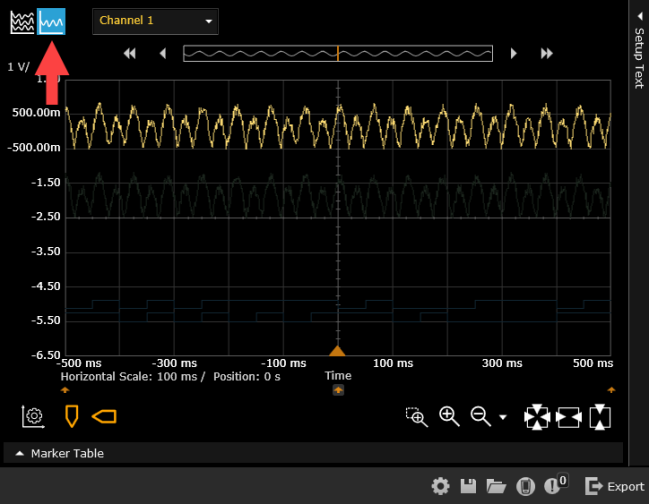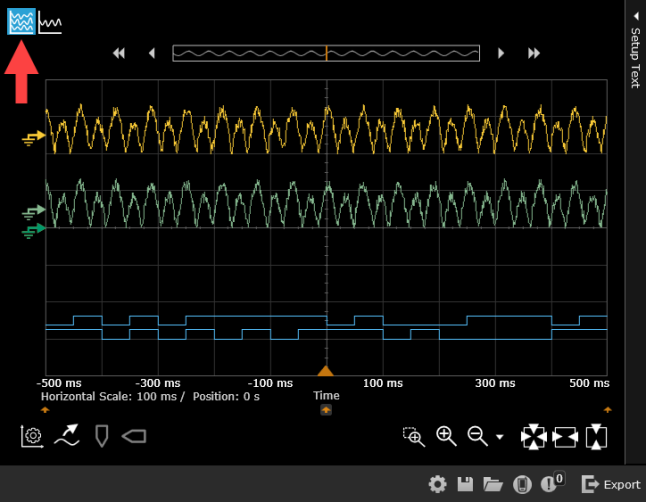
Trace data captured from the oscilloscope can be displayed as a Group Chart (view multiple waveform traces or measurements) or a Single Chart (view and analyze a single waveform trace or measurement).
The Group Chart view displays the selected waveform traces or measurements over time.
The Single Chart view enables you to view and analyze the waveform trace or measurement selected from the drop-down list next to the Single Chart icon. In the Single Chart view only, you can also use vertical and horizontal markers to gather additional information from the selected trace or measurement.